


Ether has dropped nearly 70% versus Bitcoin since the Merge, weakening Ethereum’s market position and raising questions about its price outlook.
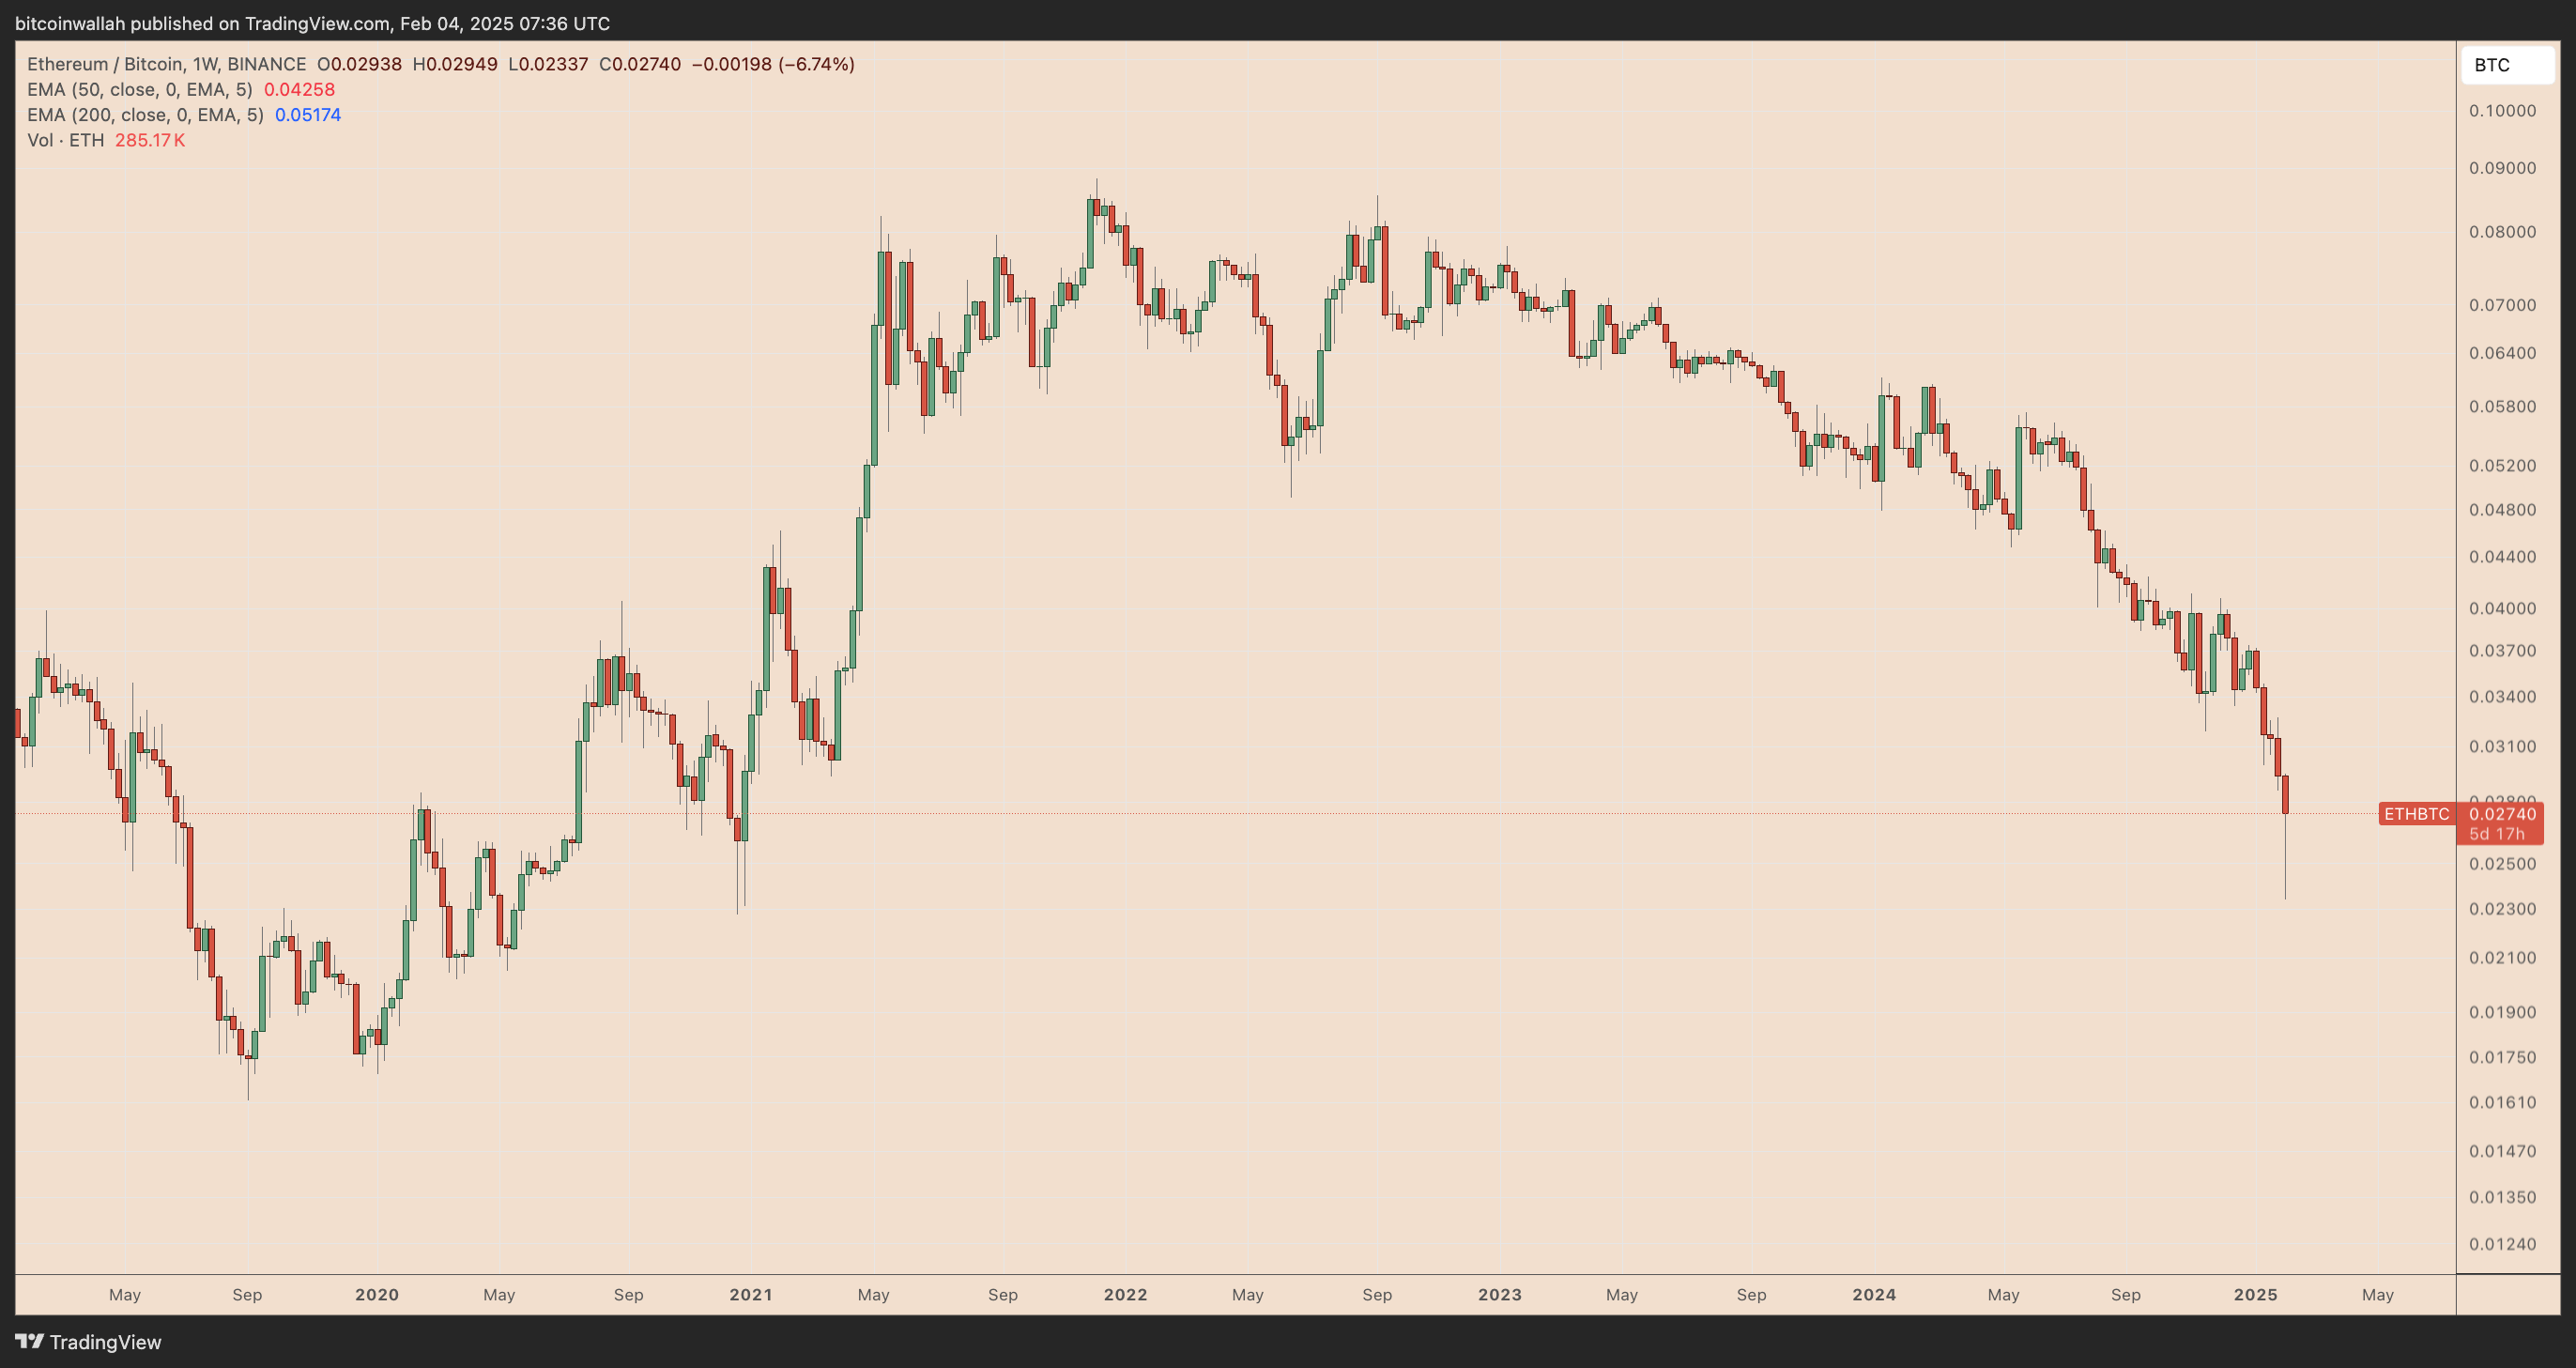 ETH/BTC weekly performance chart. Source: TradingView
Ethereum’s transition to proof-of-stake (PoS) in September 2022 aimed to be a game-changer for the network.
It promised to improve energy efficiency and make ETH a “deflationary” asset by reducing its supply over time, with some analysts predicting it would flip Bitcoin’s market cap.
However, more than two years later, Ethereum’s performance tells a different story, as Bitcoin has gained around 160% against Ether since the Merge.
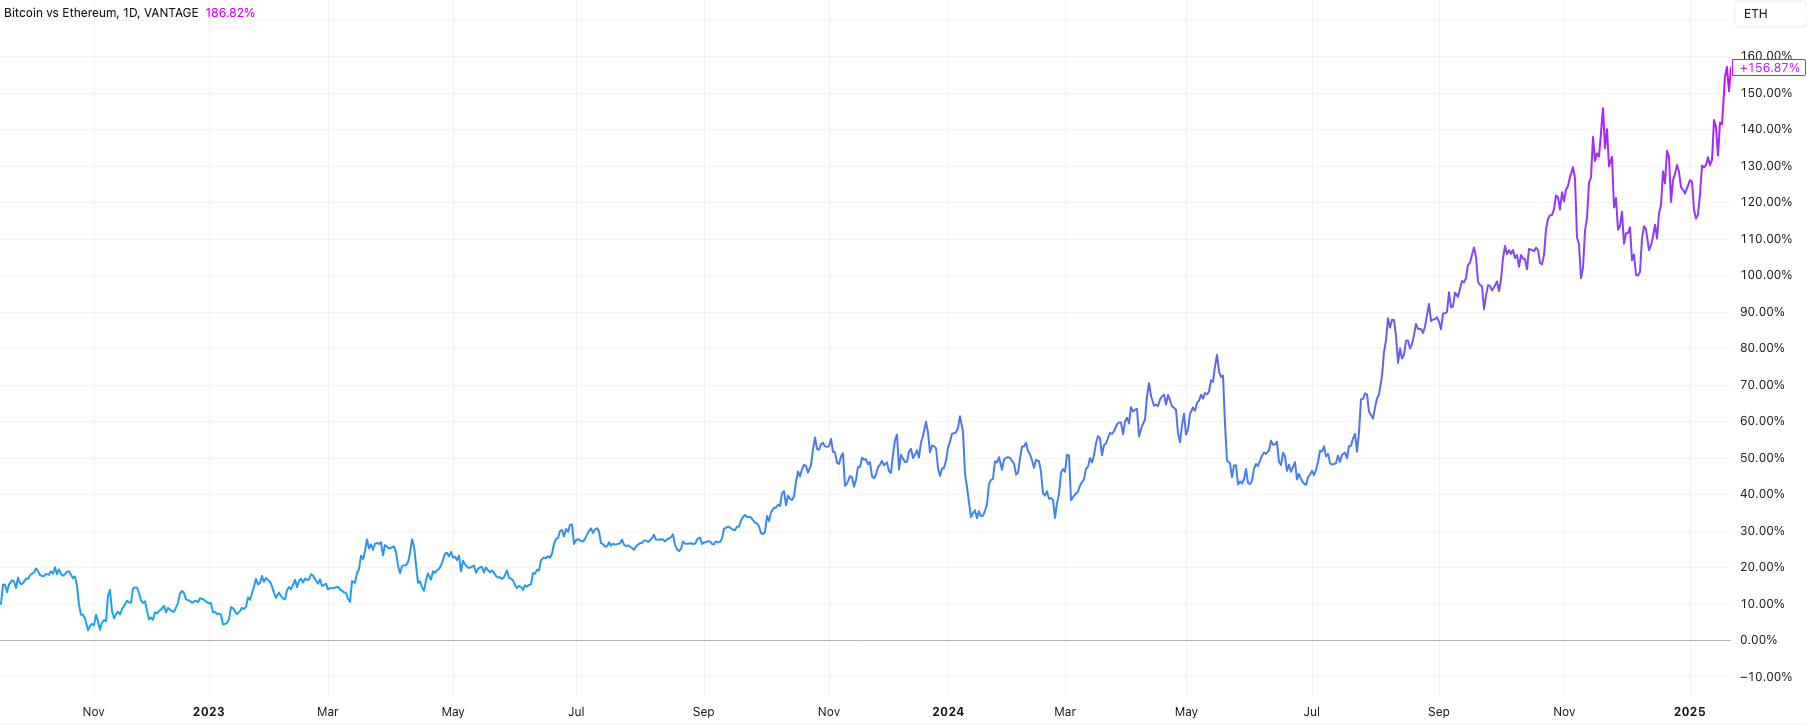 BTC/ETH performance since the Merge. Source: TradingView
ETH supply rate near positive 2.5 years after Merge
As of Feb. 4, Ethereum’s supply growth rate was hovering near 0%, according to UltraSound.Money, showing that the Merge’s disinflationary effect has stalled despite initially reducing Ether’s supply.
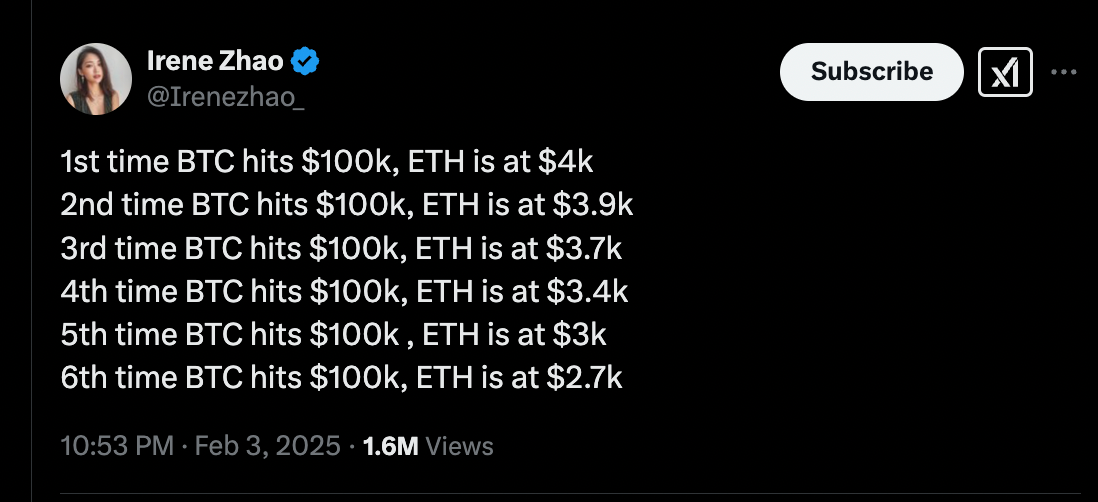
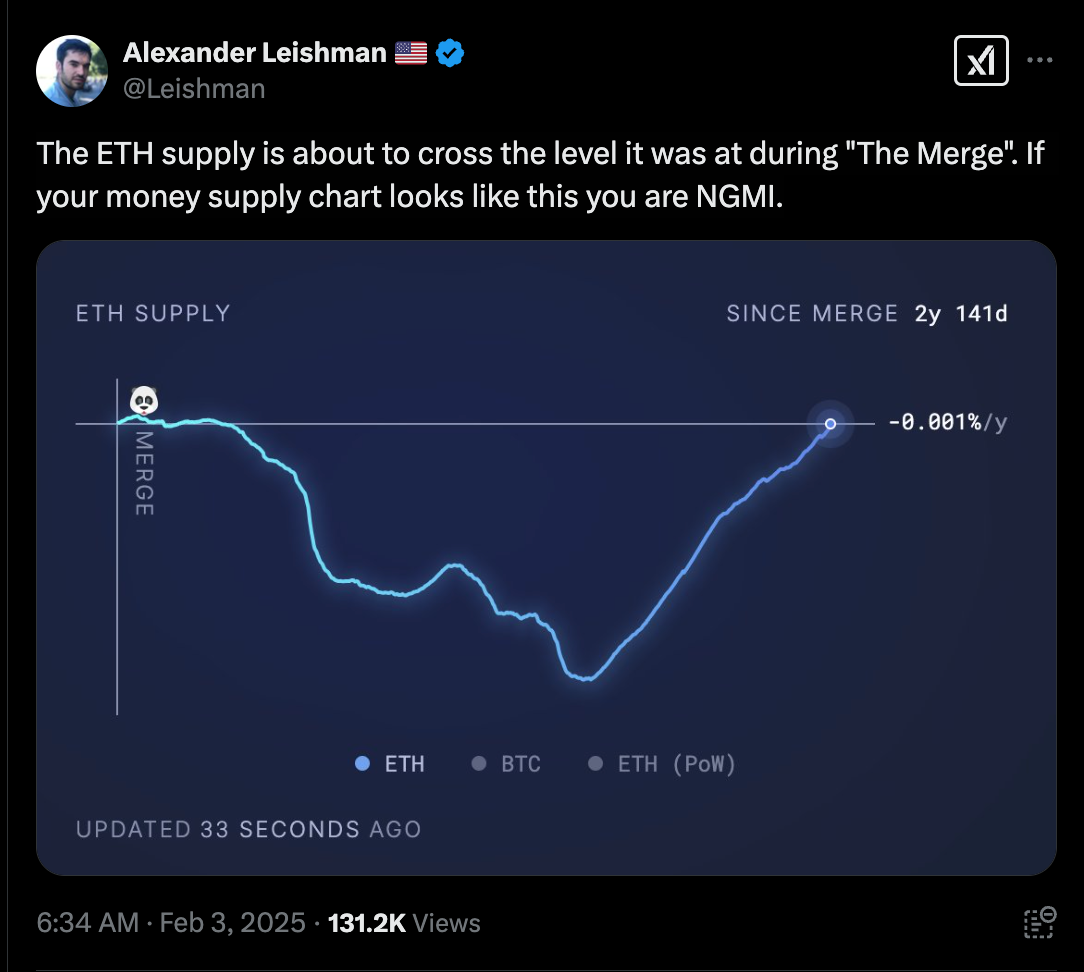 Source: X
At its best, the supply rate was -0.37% in April 2024.
Ethereum’s deflationary mechanism relies heavily on EIP-1559, which burns a portion of transaction fees. However, as onchain activity decreases, gas fees drop, leading to fewer ETH burns.
Data from Token Terminal illustrates this trend. Ethereum’s average transaction fee peaked above $15 in March 2024 but saw a sharp decline by April, dropping below $5.
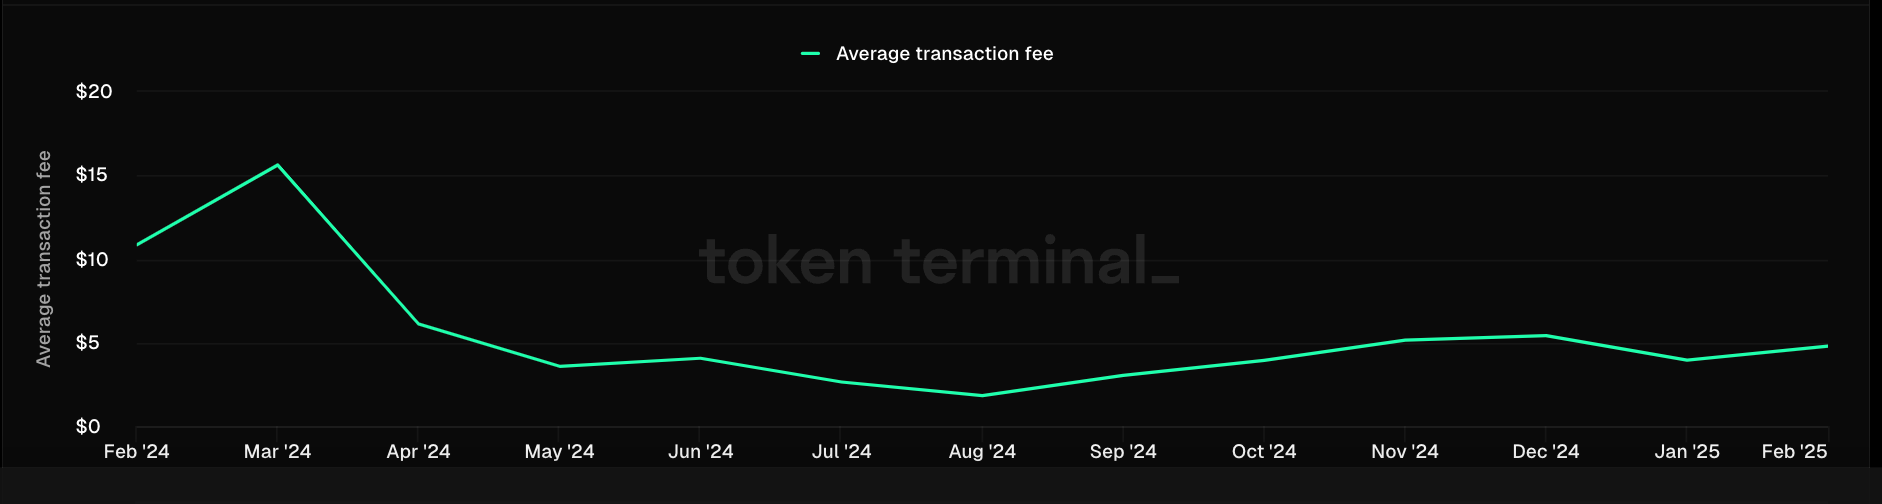 Ethereum average transaction fees (1-year). Source: Token Terminal
The downward trend persisted throughout mid-2024, reflecting a steady decrease in network demand. While fees stabilized in late 2024 and early 2025, they now remain well below previous highs, resulting in a rising Ether supply.
Investors offloading Ethereum: On-chain data
Ethereum’s long-term holders have reduced their exposure since the Merge, according to data shared by Joao Wedson, CEO of Alphractal.
Alphractal’s data shows that wallets holding 100,000 ETH or more have massively decreased their holdings, while addresses with 1 million ETH have also decreased.
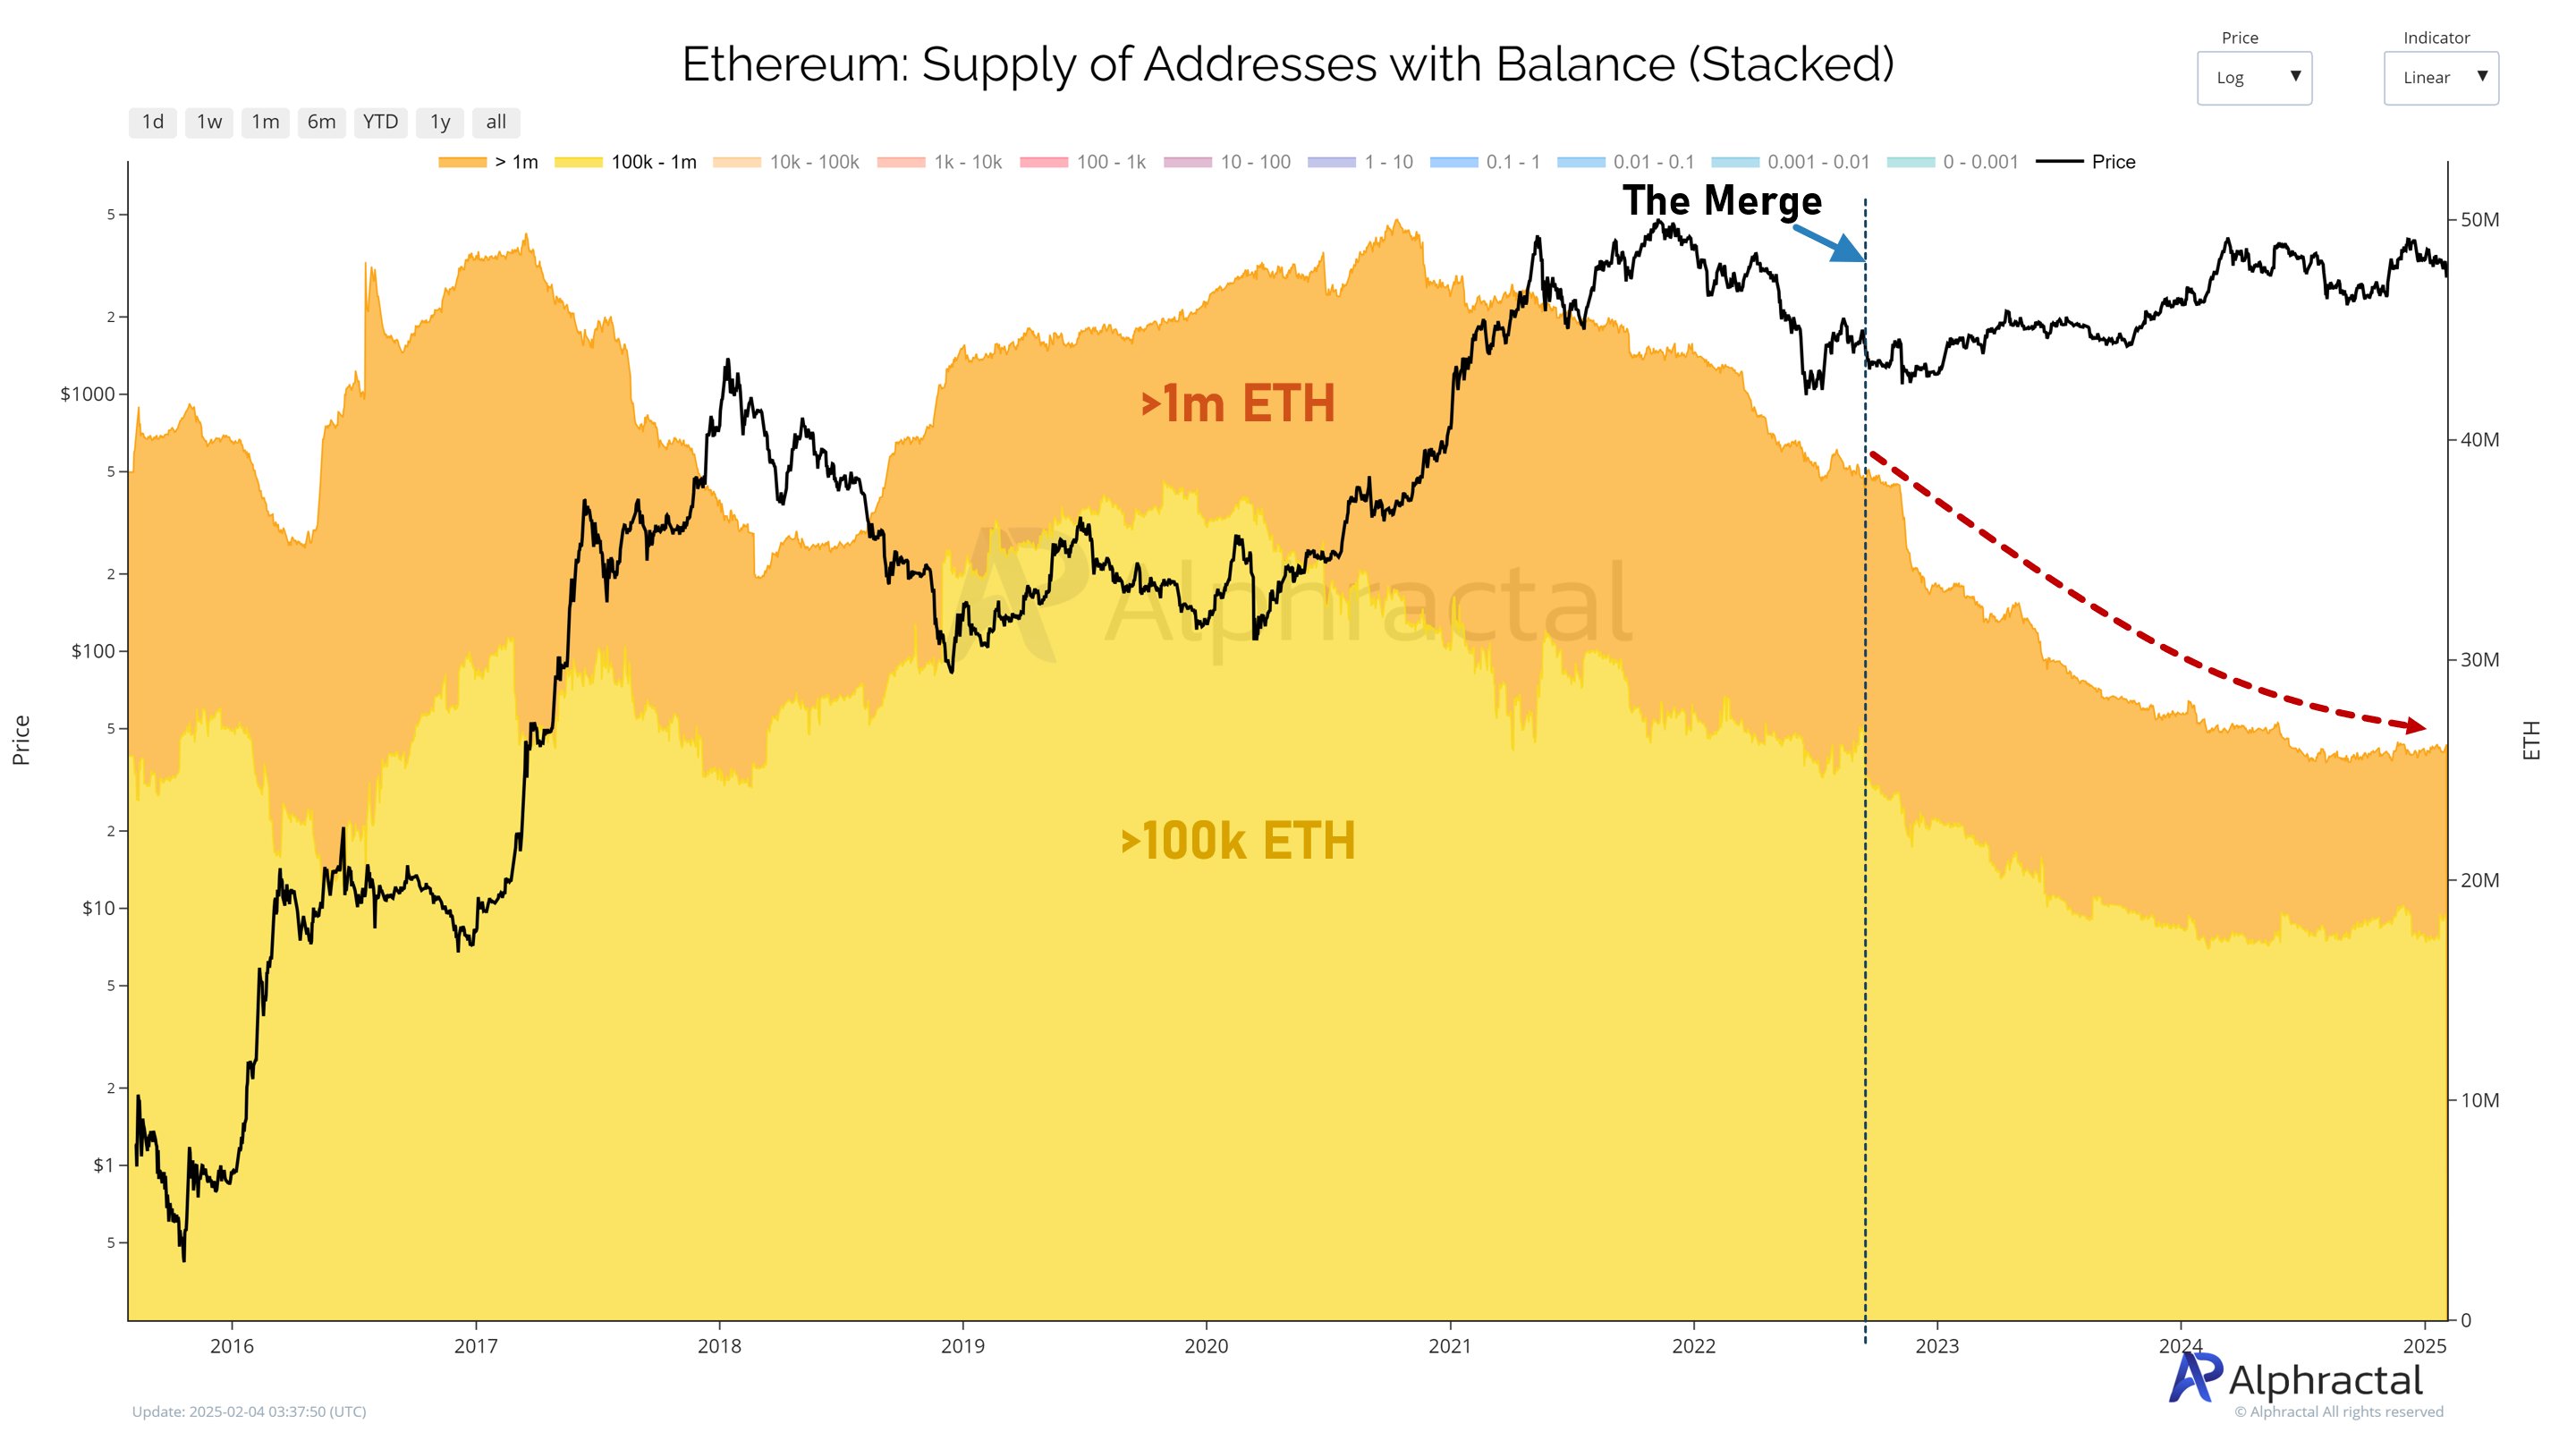 Ethereum addresses with a minimum 1M and 100K ETH balance. Source: Alphractal
“Long-Term and Short-Term Holders stopped accumulating ETH since September 2022,” Wedson said, adding:
“Even Exchange addresses, former miners, and funds with over 100k ETH aren’t buying.”
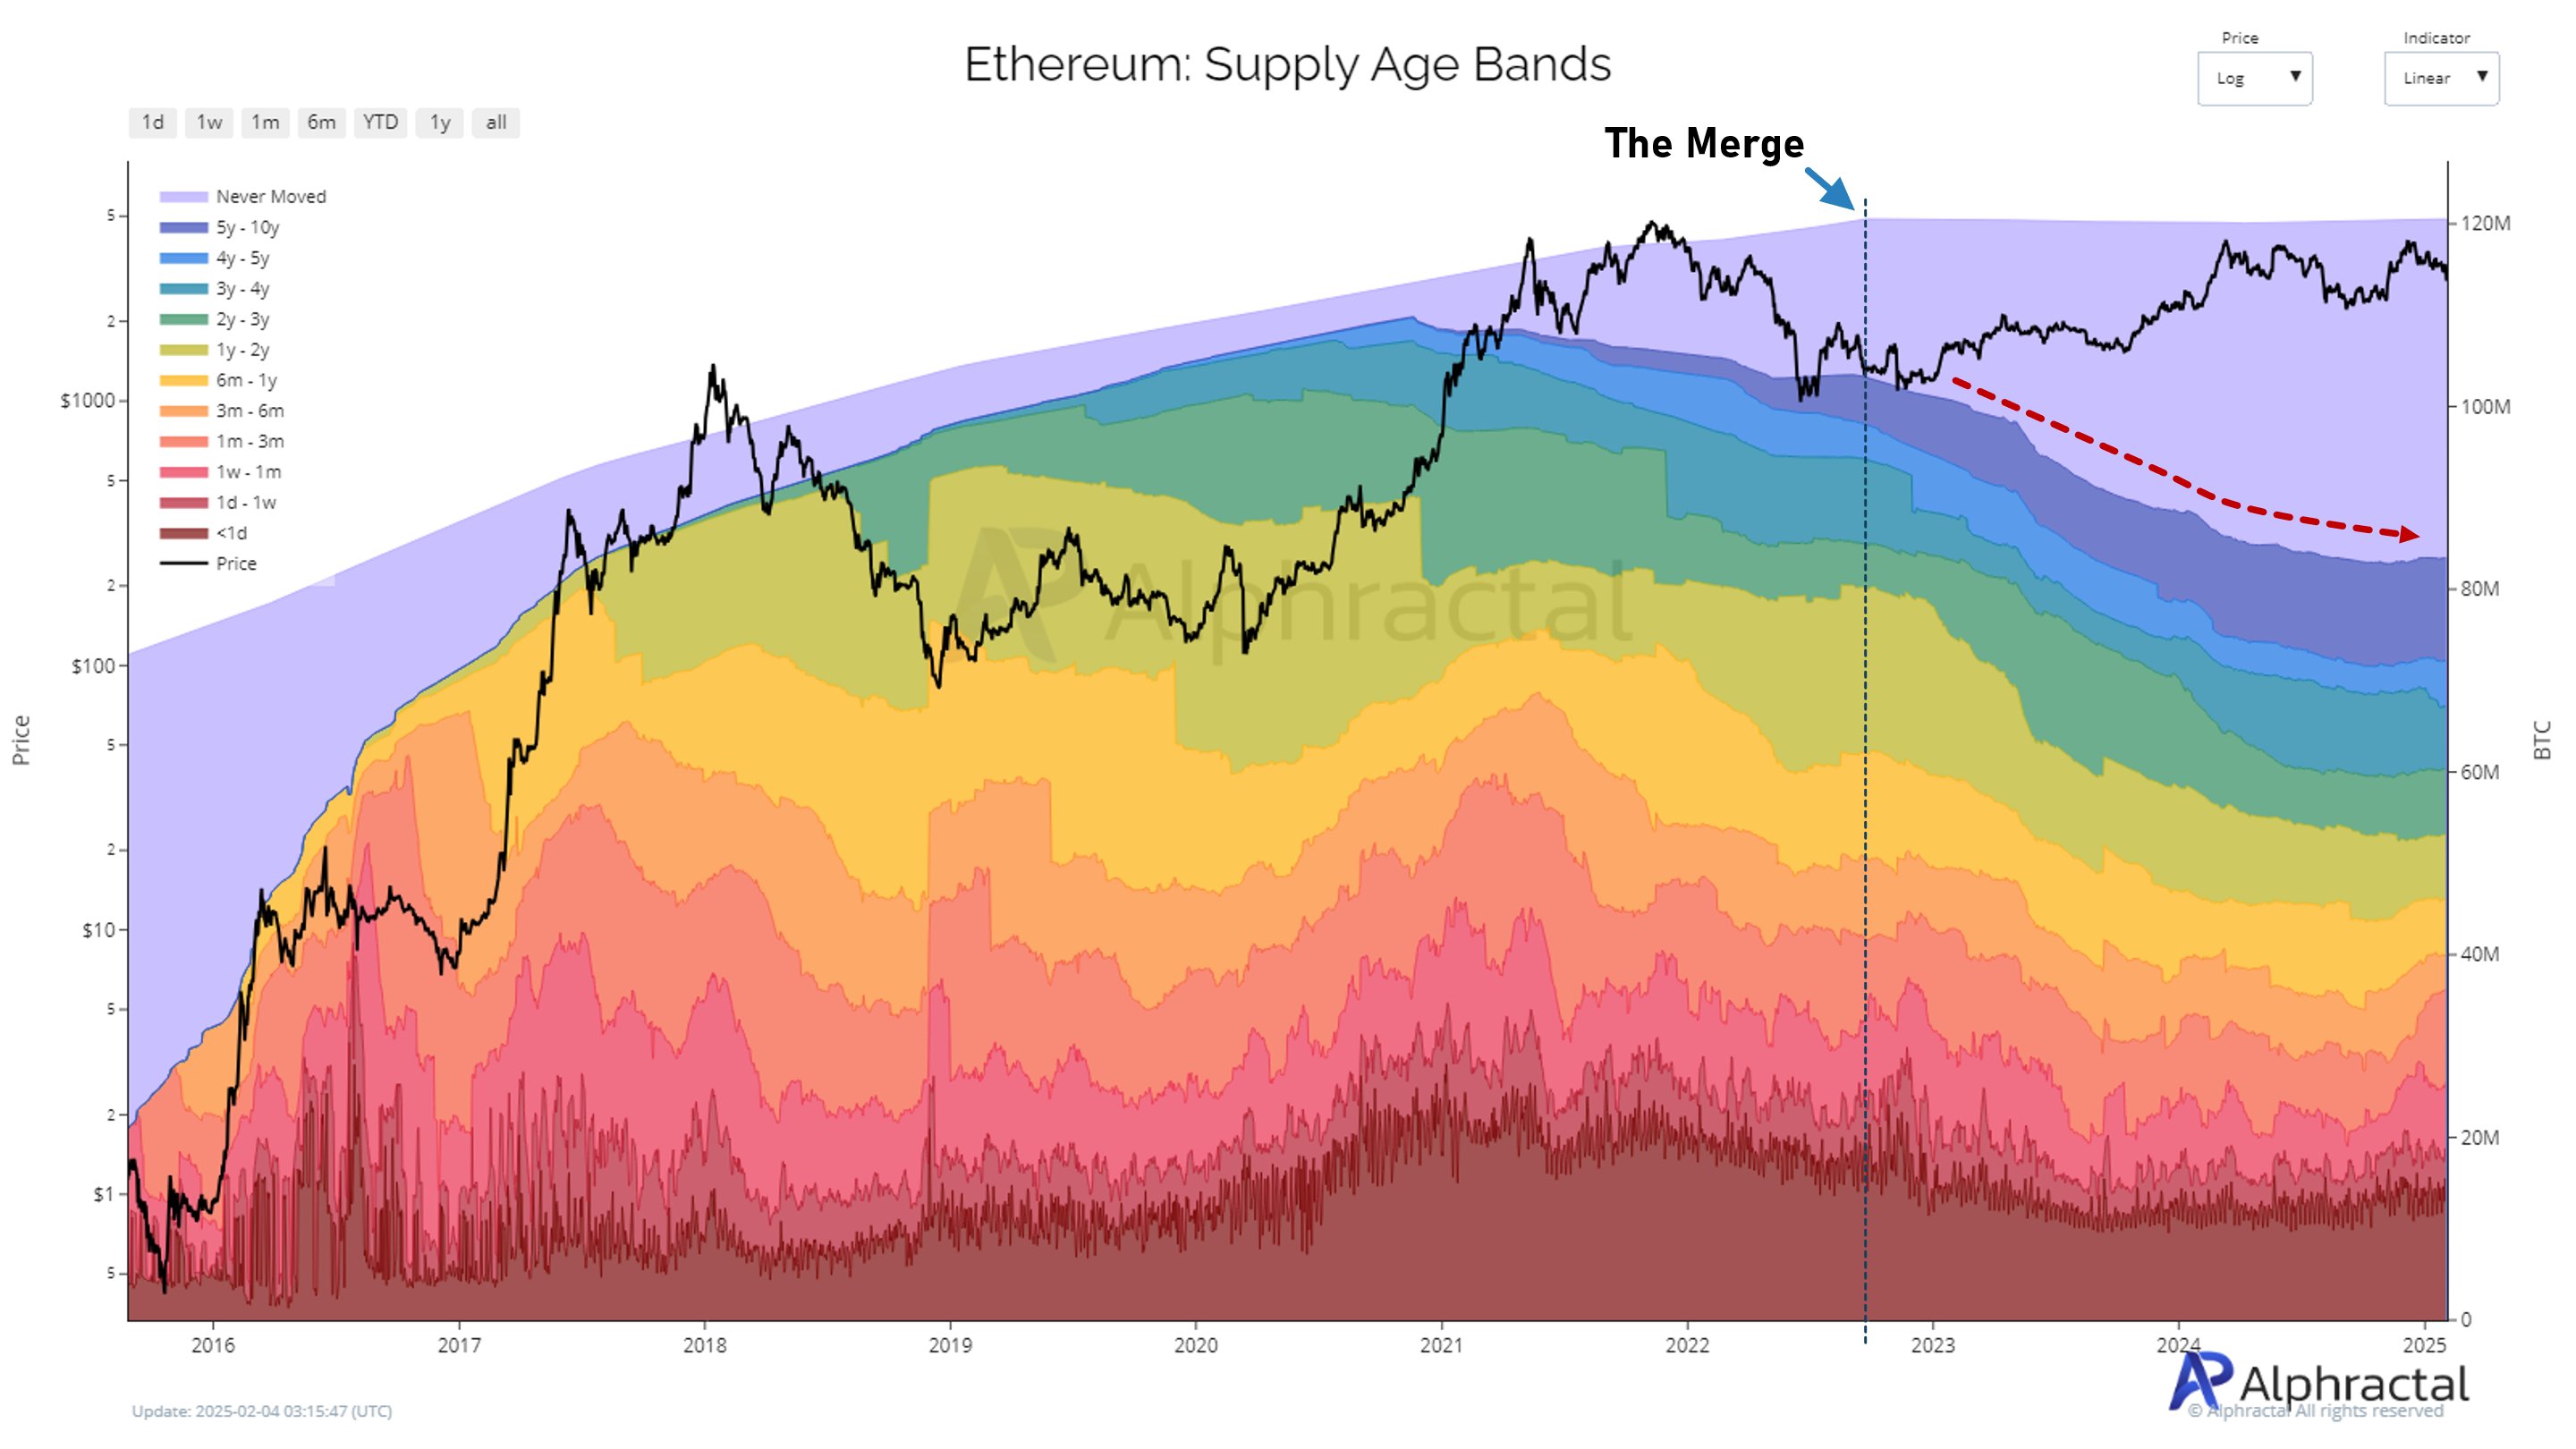 Ethereum supply age bands. Source: Alphractal
Solana, in particular, has emerged as Ethereum’s biggest rival, attracting DeFi and NFT projects that might have otherwise launched on Ethereum. It now commands nearly half of the DEX market, fueled by the Pump.fun memecoin launchpad, which recently surpassed Ethereum in daily volume.
However, Ethereum co-founder Joseph Lubin refers to Ether’s underperformance as regular market cycle occurrence, saying:
 Source: X
Can ETH/BTC recover?
Ethereum’s weekly chart shows ETH/BTC in oversold territory, according to the Relative Strength Index (RSI). Simultaneously, the pair is trading near a historical support area defined by the 0.024-0.023 BTC range.
Both indicators have led to bounces in the past, signaling that a relief rally could be on the horizon in the coming weeks. In this case, ETH/BTC can rise toward its 50-week exponential moving average (50-week EMA; the red wave) at around 0.042 BTC by March or April.